EU 2022 Greenhouse Gas Emissions by Country and Sector
I analysed the 2022 EU greenhouse gas emissions data from the European Environment Agency. I looked at how the emissions varied from country to country across various sectors and sub-sectors of the economy. As well as total emissions I also looked at per capita emissions and the percentage share of each sector or sub-sector of the economy in overall emissions or in sectoral emissions.
I've saved each of the plots in a Django database (using a created model) and have created the below form to display the plot requested by the user - give it a try!
Emissions calculation: Total
Sector: Overall
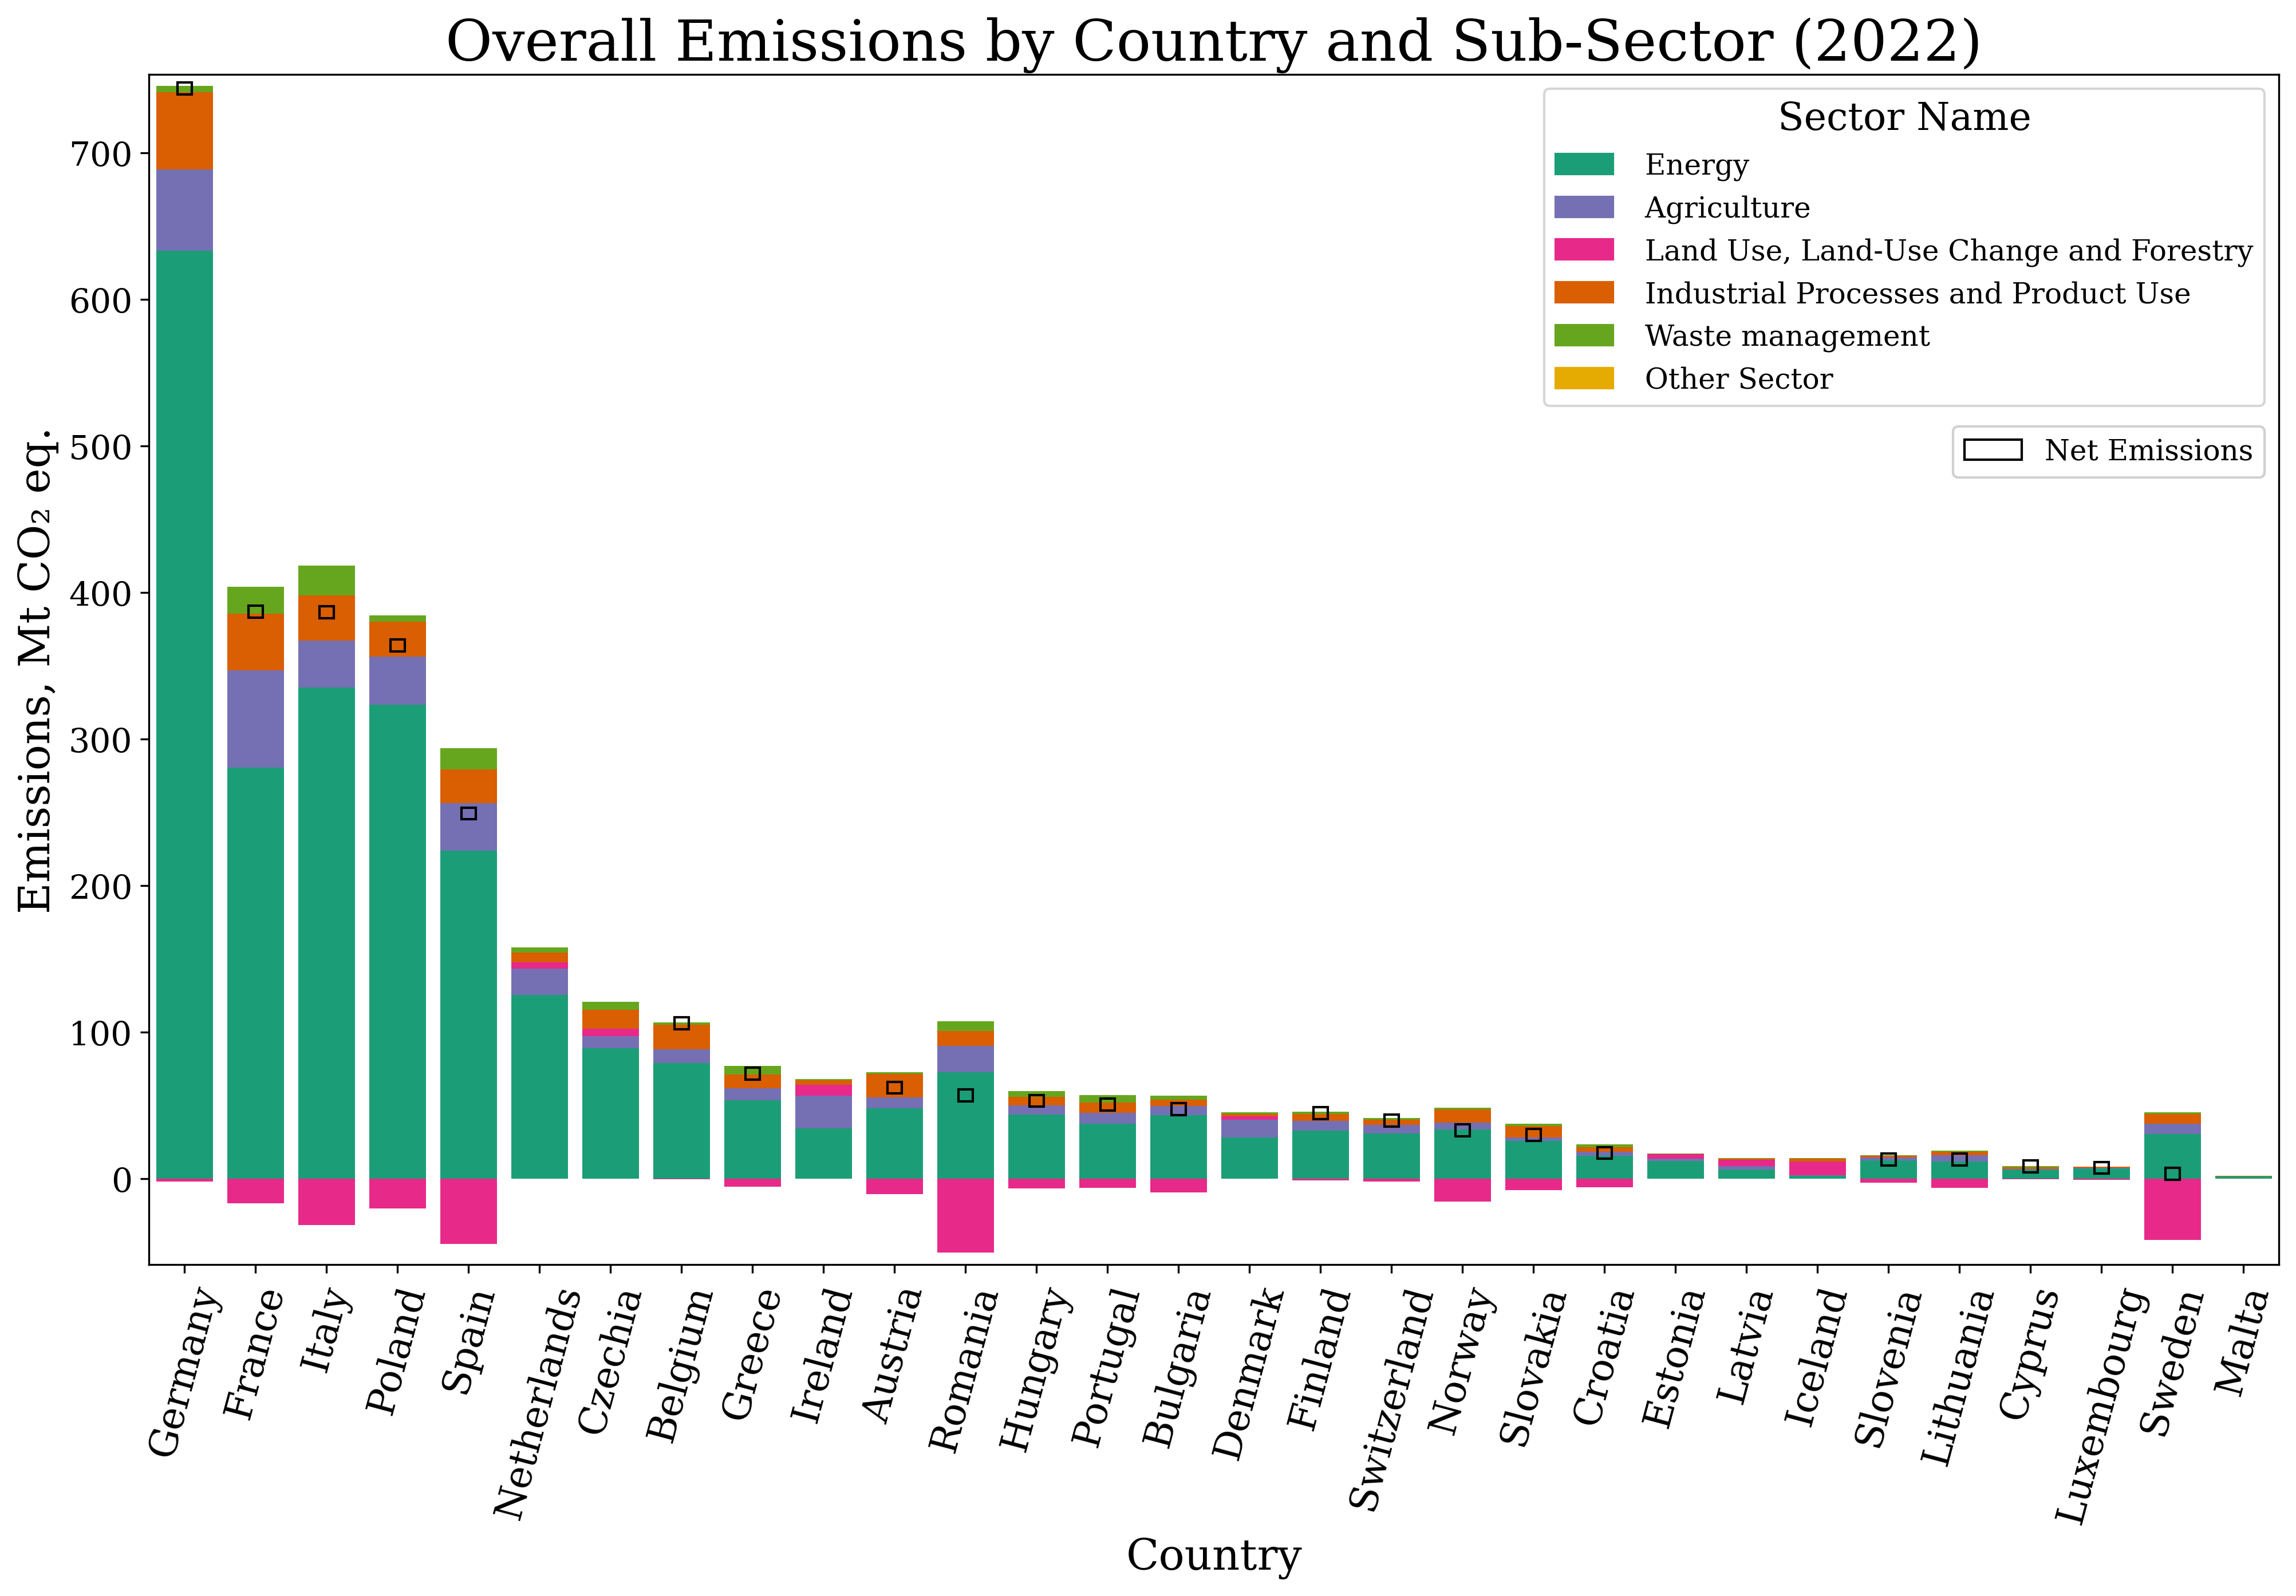
The total greenhouse gas emissions for each country in 2022 is displayed in the barplot. The countries are ordered from the largest emitting country, Germany, on the left hand side to the lowest emitting country, Malta, on the right hand side. Each bar is split into the reported sectors of the economies with the ordering of sectors from those with the highest emissions, Energy, to those with the lowest emissions, Other Sectors. For some countries the Land Use, Land-Use Change and Forestry emissions are negative representing absorption of greenhouse gases. In these cases the net emissions of the country is indicated by a rectangular patch on the bar. Ireland has the 10th largest emissions for 2022.
The code to generate these plots is available on my GitHub here