Variation of Guinness Pint Pricing in Dublin Postal Regions (2017-18)
In this project I obtained Guinness pint price data from the Guindex website using the python package that I published. I restricted the scope of the analysis to user pint price submissions from Dublin in the years 2017 and 2018. A shapefile with the Dublin postal regions was obtained for this analysis. The original projection of the shapefile was the TM75 Irish Grid projection. In order to use these shapefiles with the guindex data I had to convert these into WGS 84 projection using GeoPandas. Once this was done I had to sort each of the pubs into their correct post routing administrative area. This was done by looping through each of the pubs and creating a Shapely point and then using the Polygon.contains(point) method to find out the postal area for each pub.
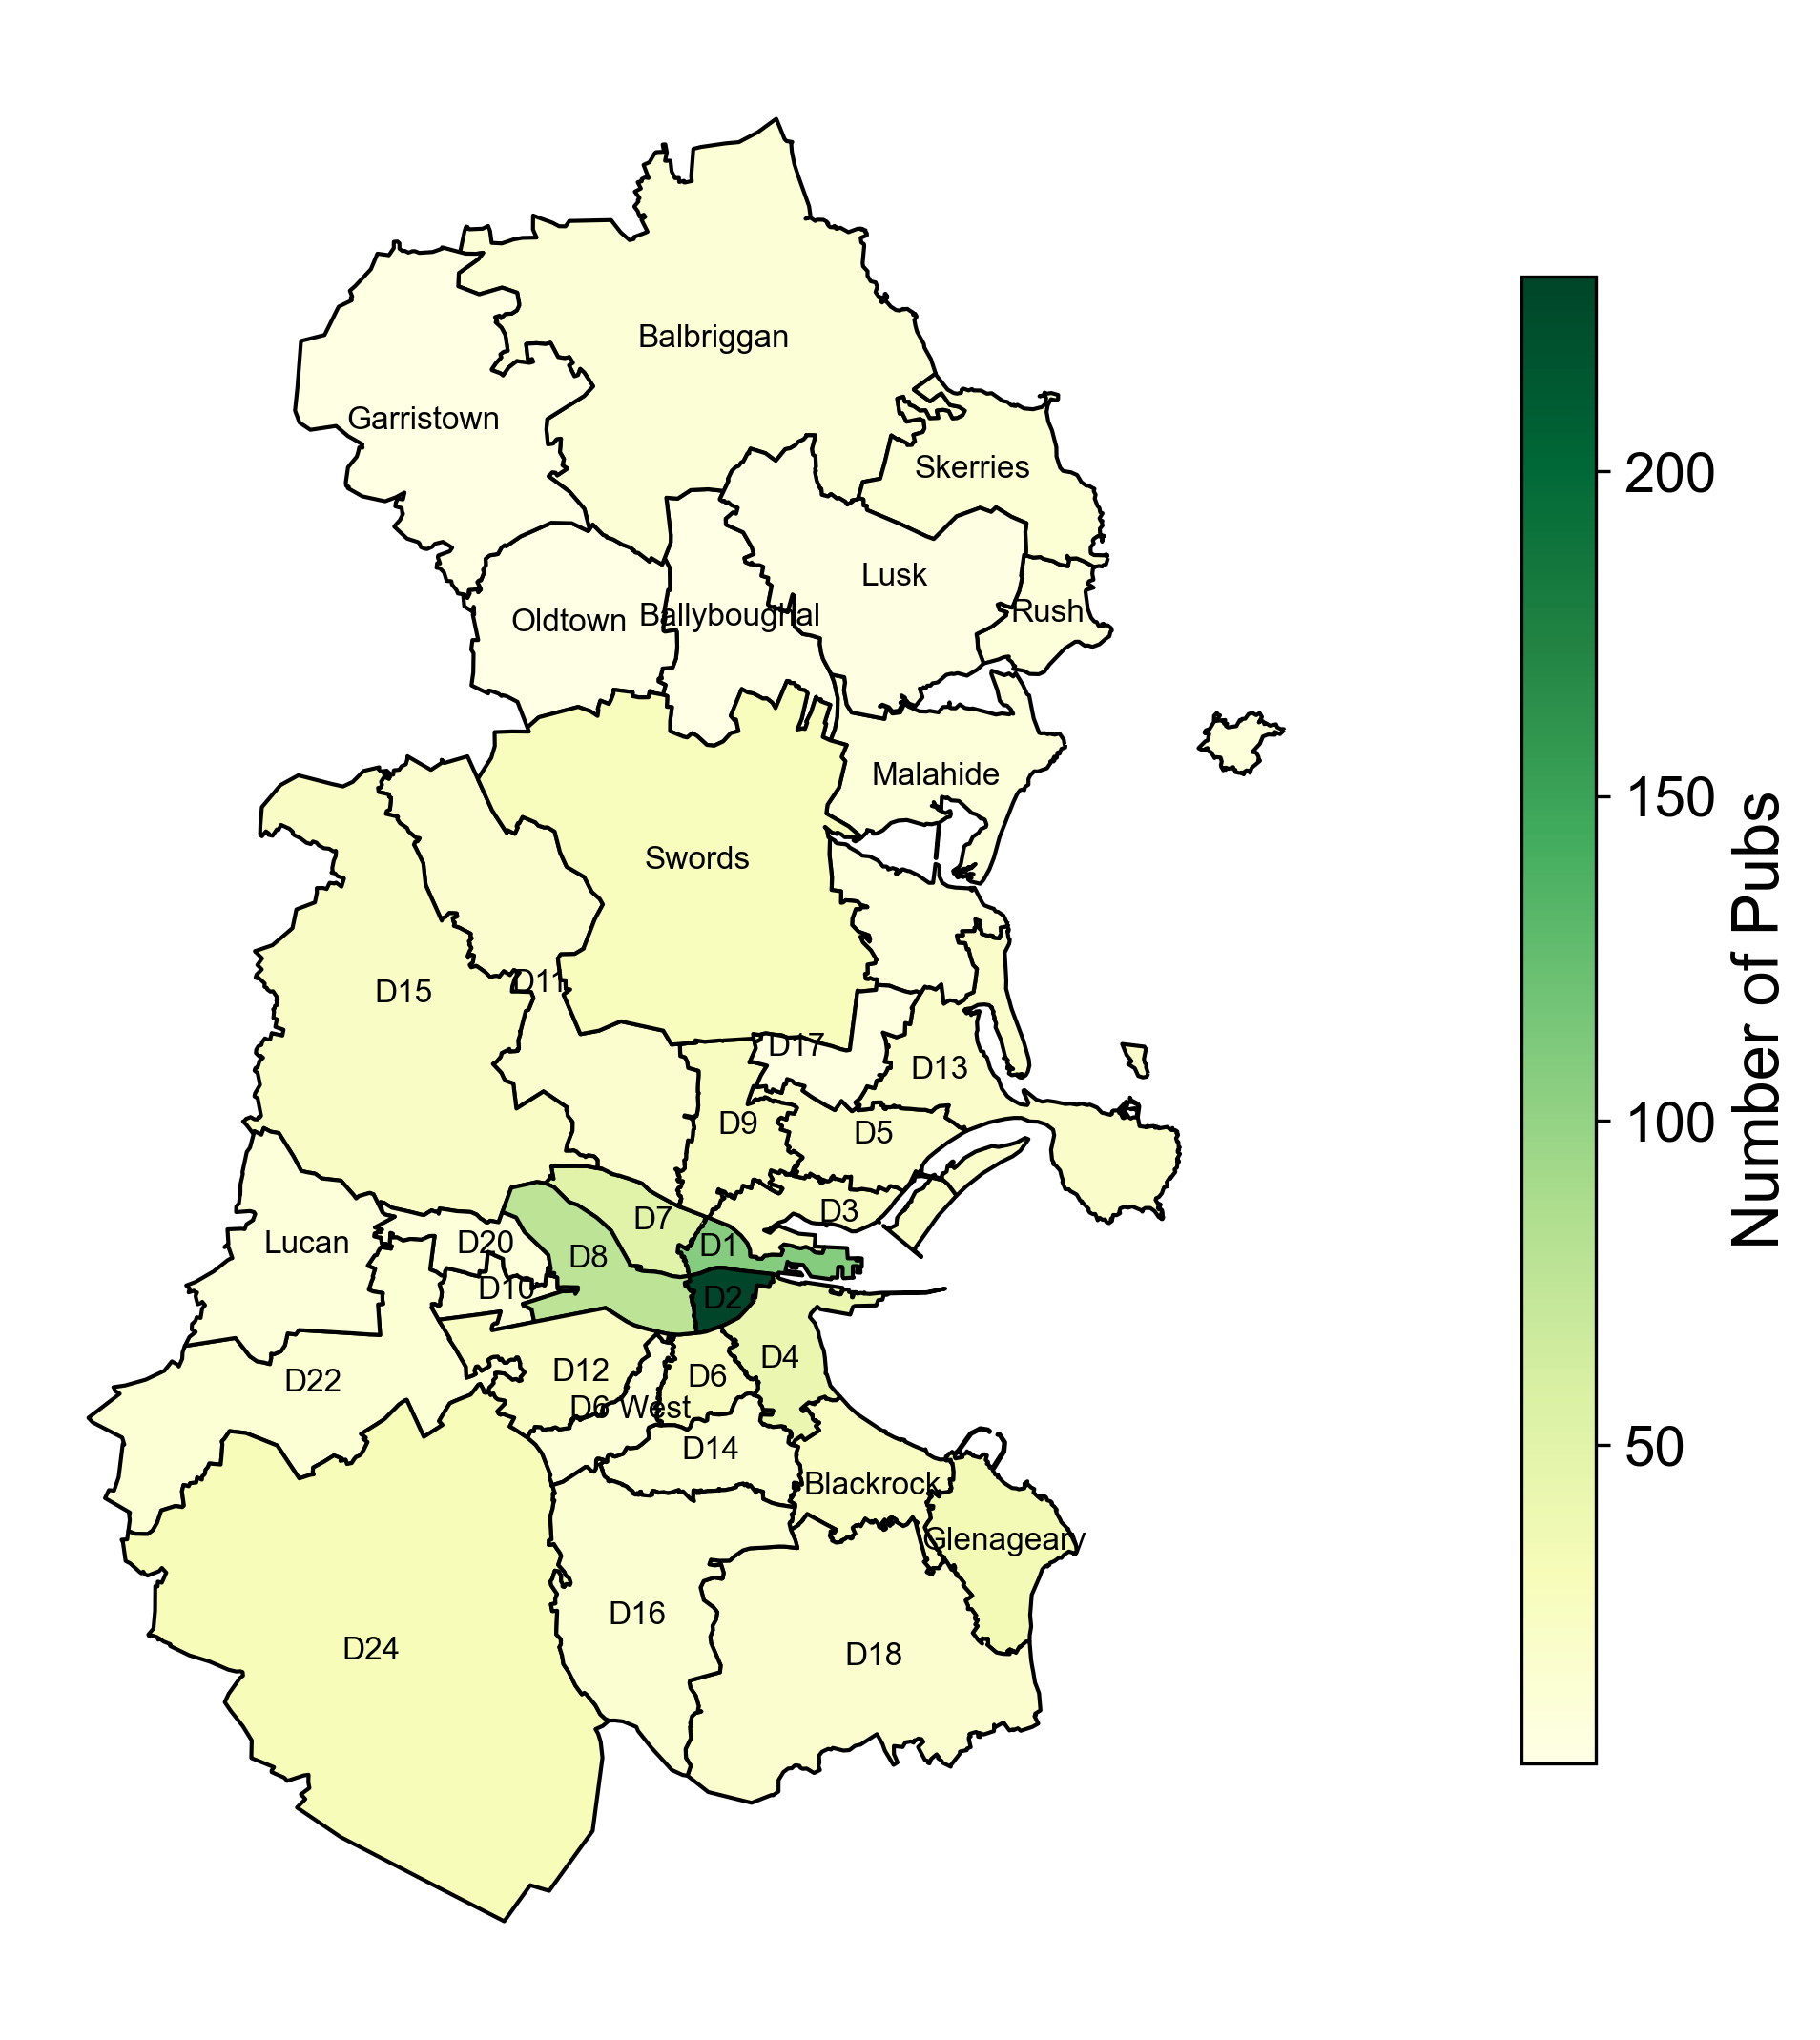
The above map was produced using GeoPandas and shows this shapefile with the postal regions. The name of each of the postal regions is annotated on the map. Additionally, there is a colourmap showing the number of pubs within each of the postal regions. Unsurprisingly, Dublin 2 has the largest number of pubs.
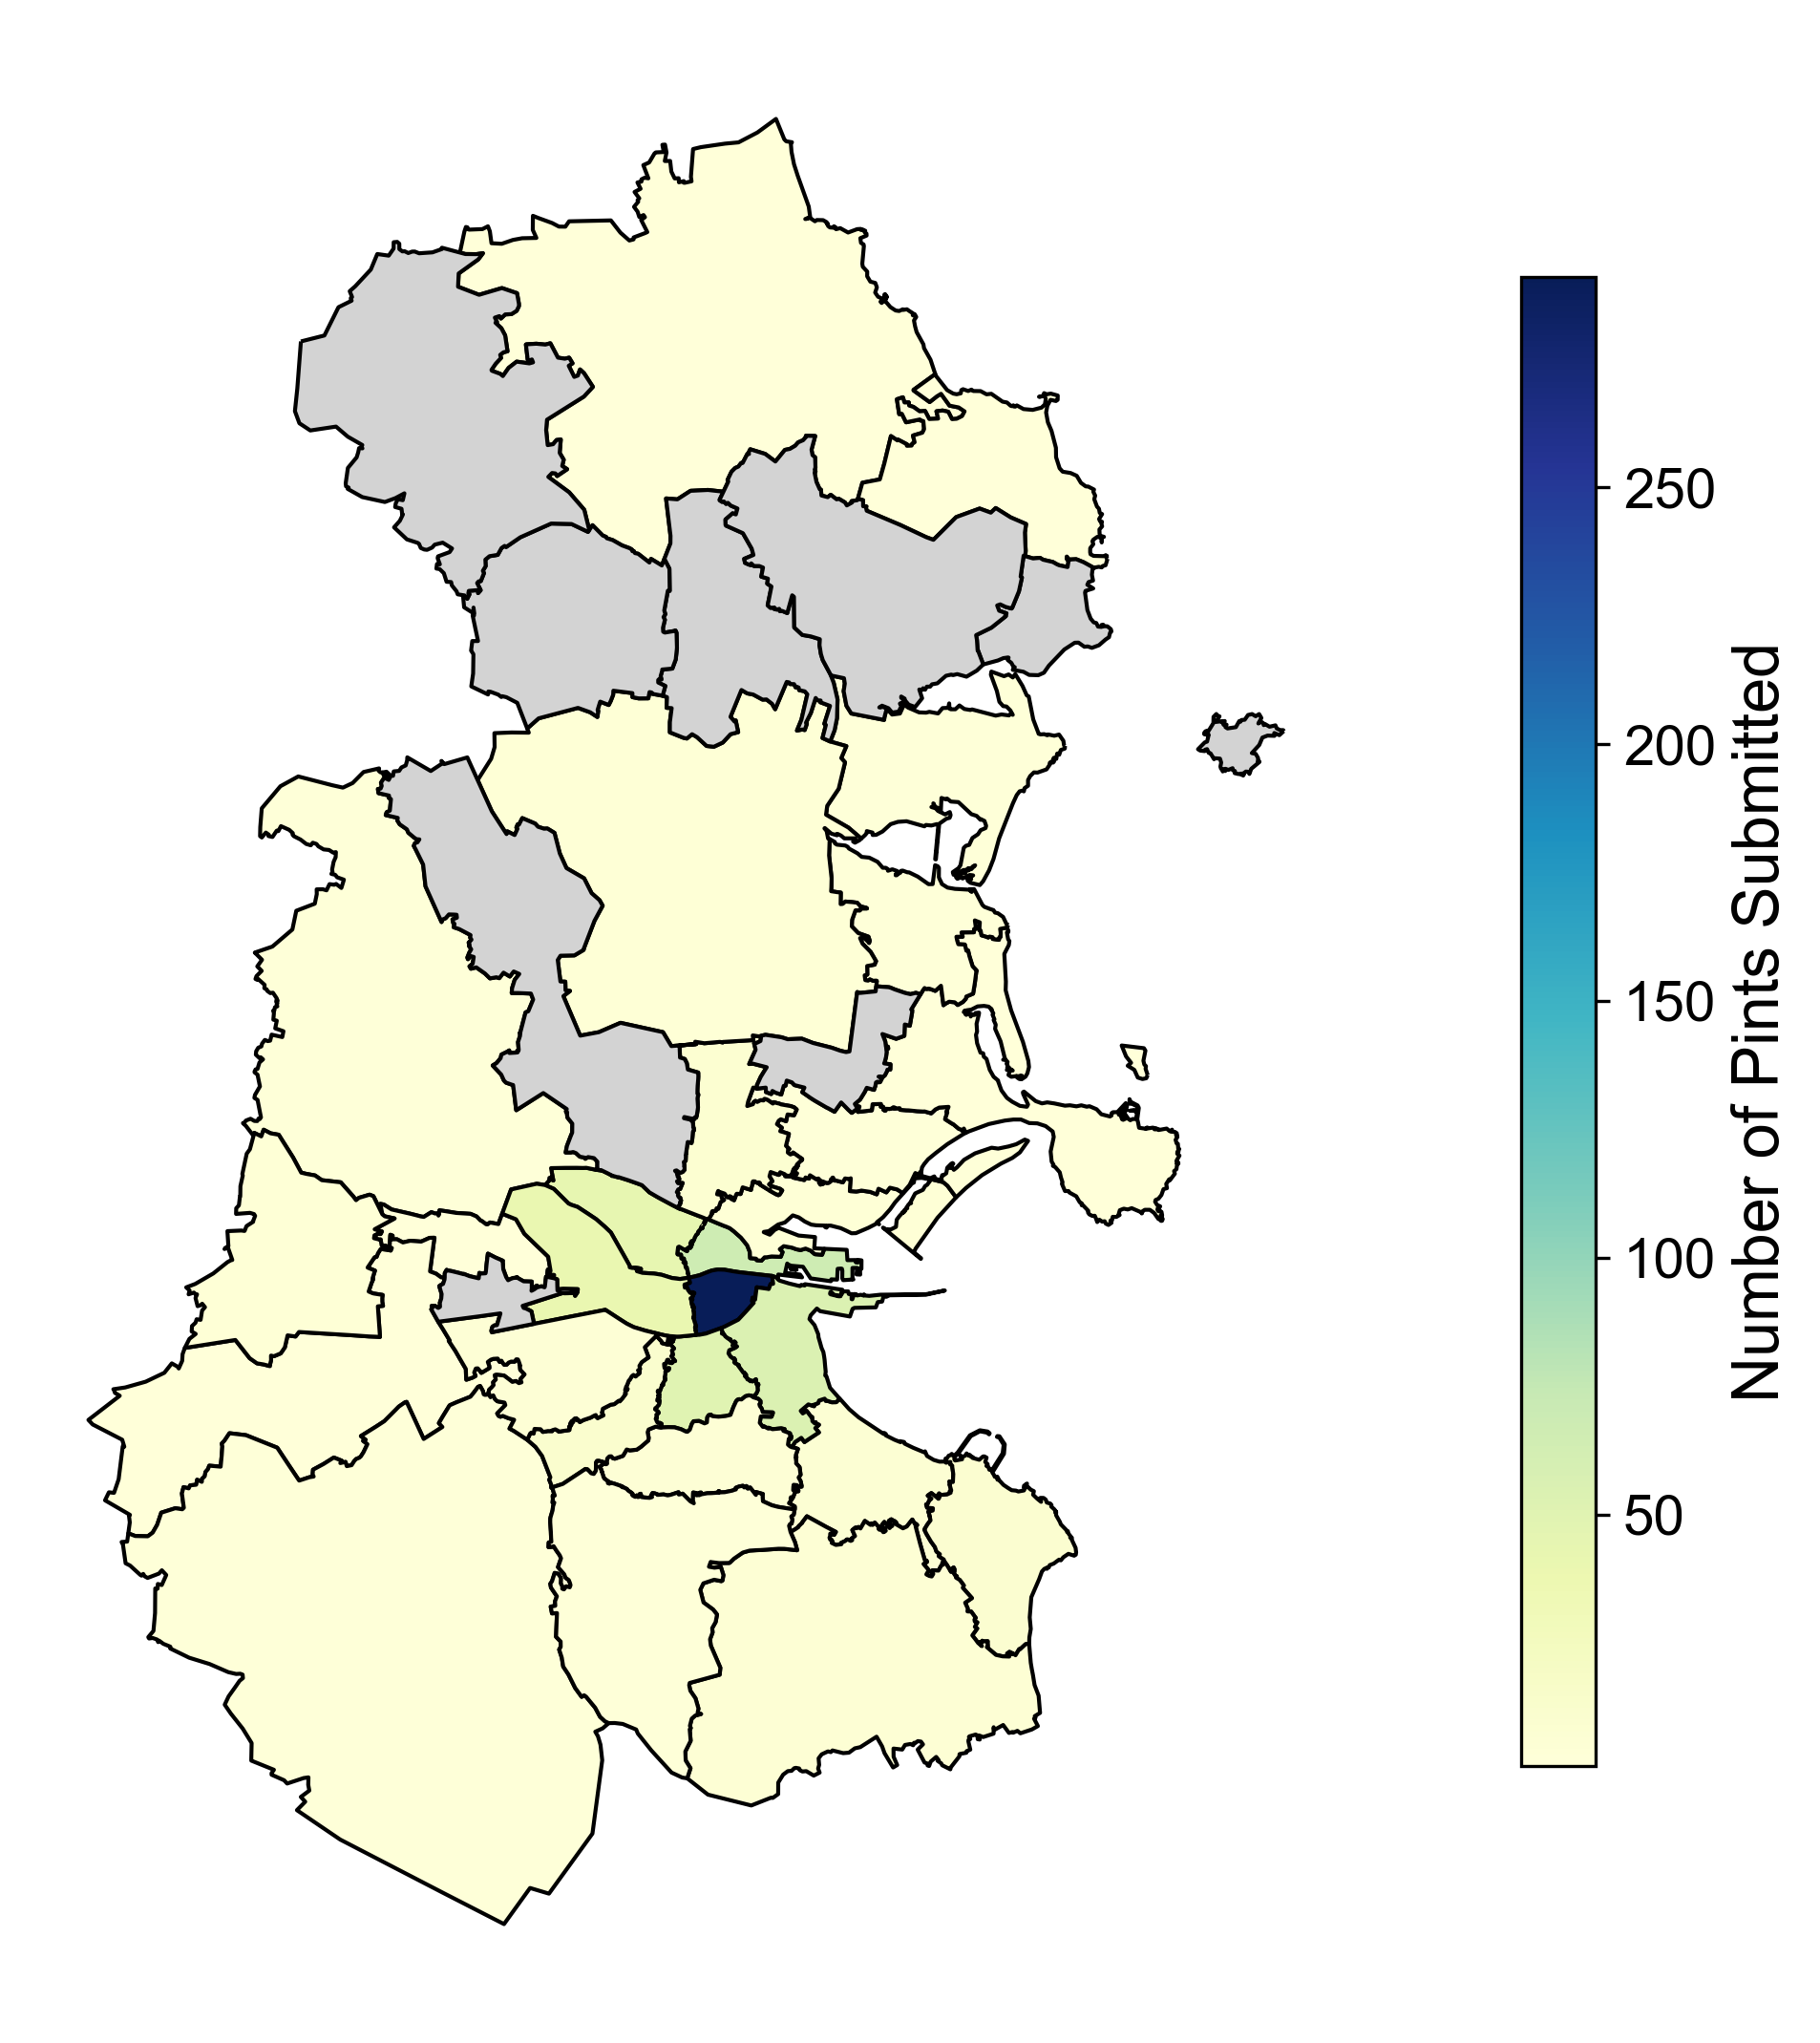
Similarly here's one of these maps (they're called (univariate) choropleth maps) showing the number of pint prices that have been submitted to the guindex during 2017-18. Dublin 2 has had the largest number of pints submitted.
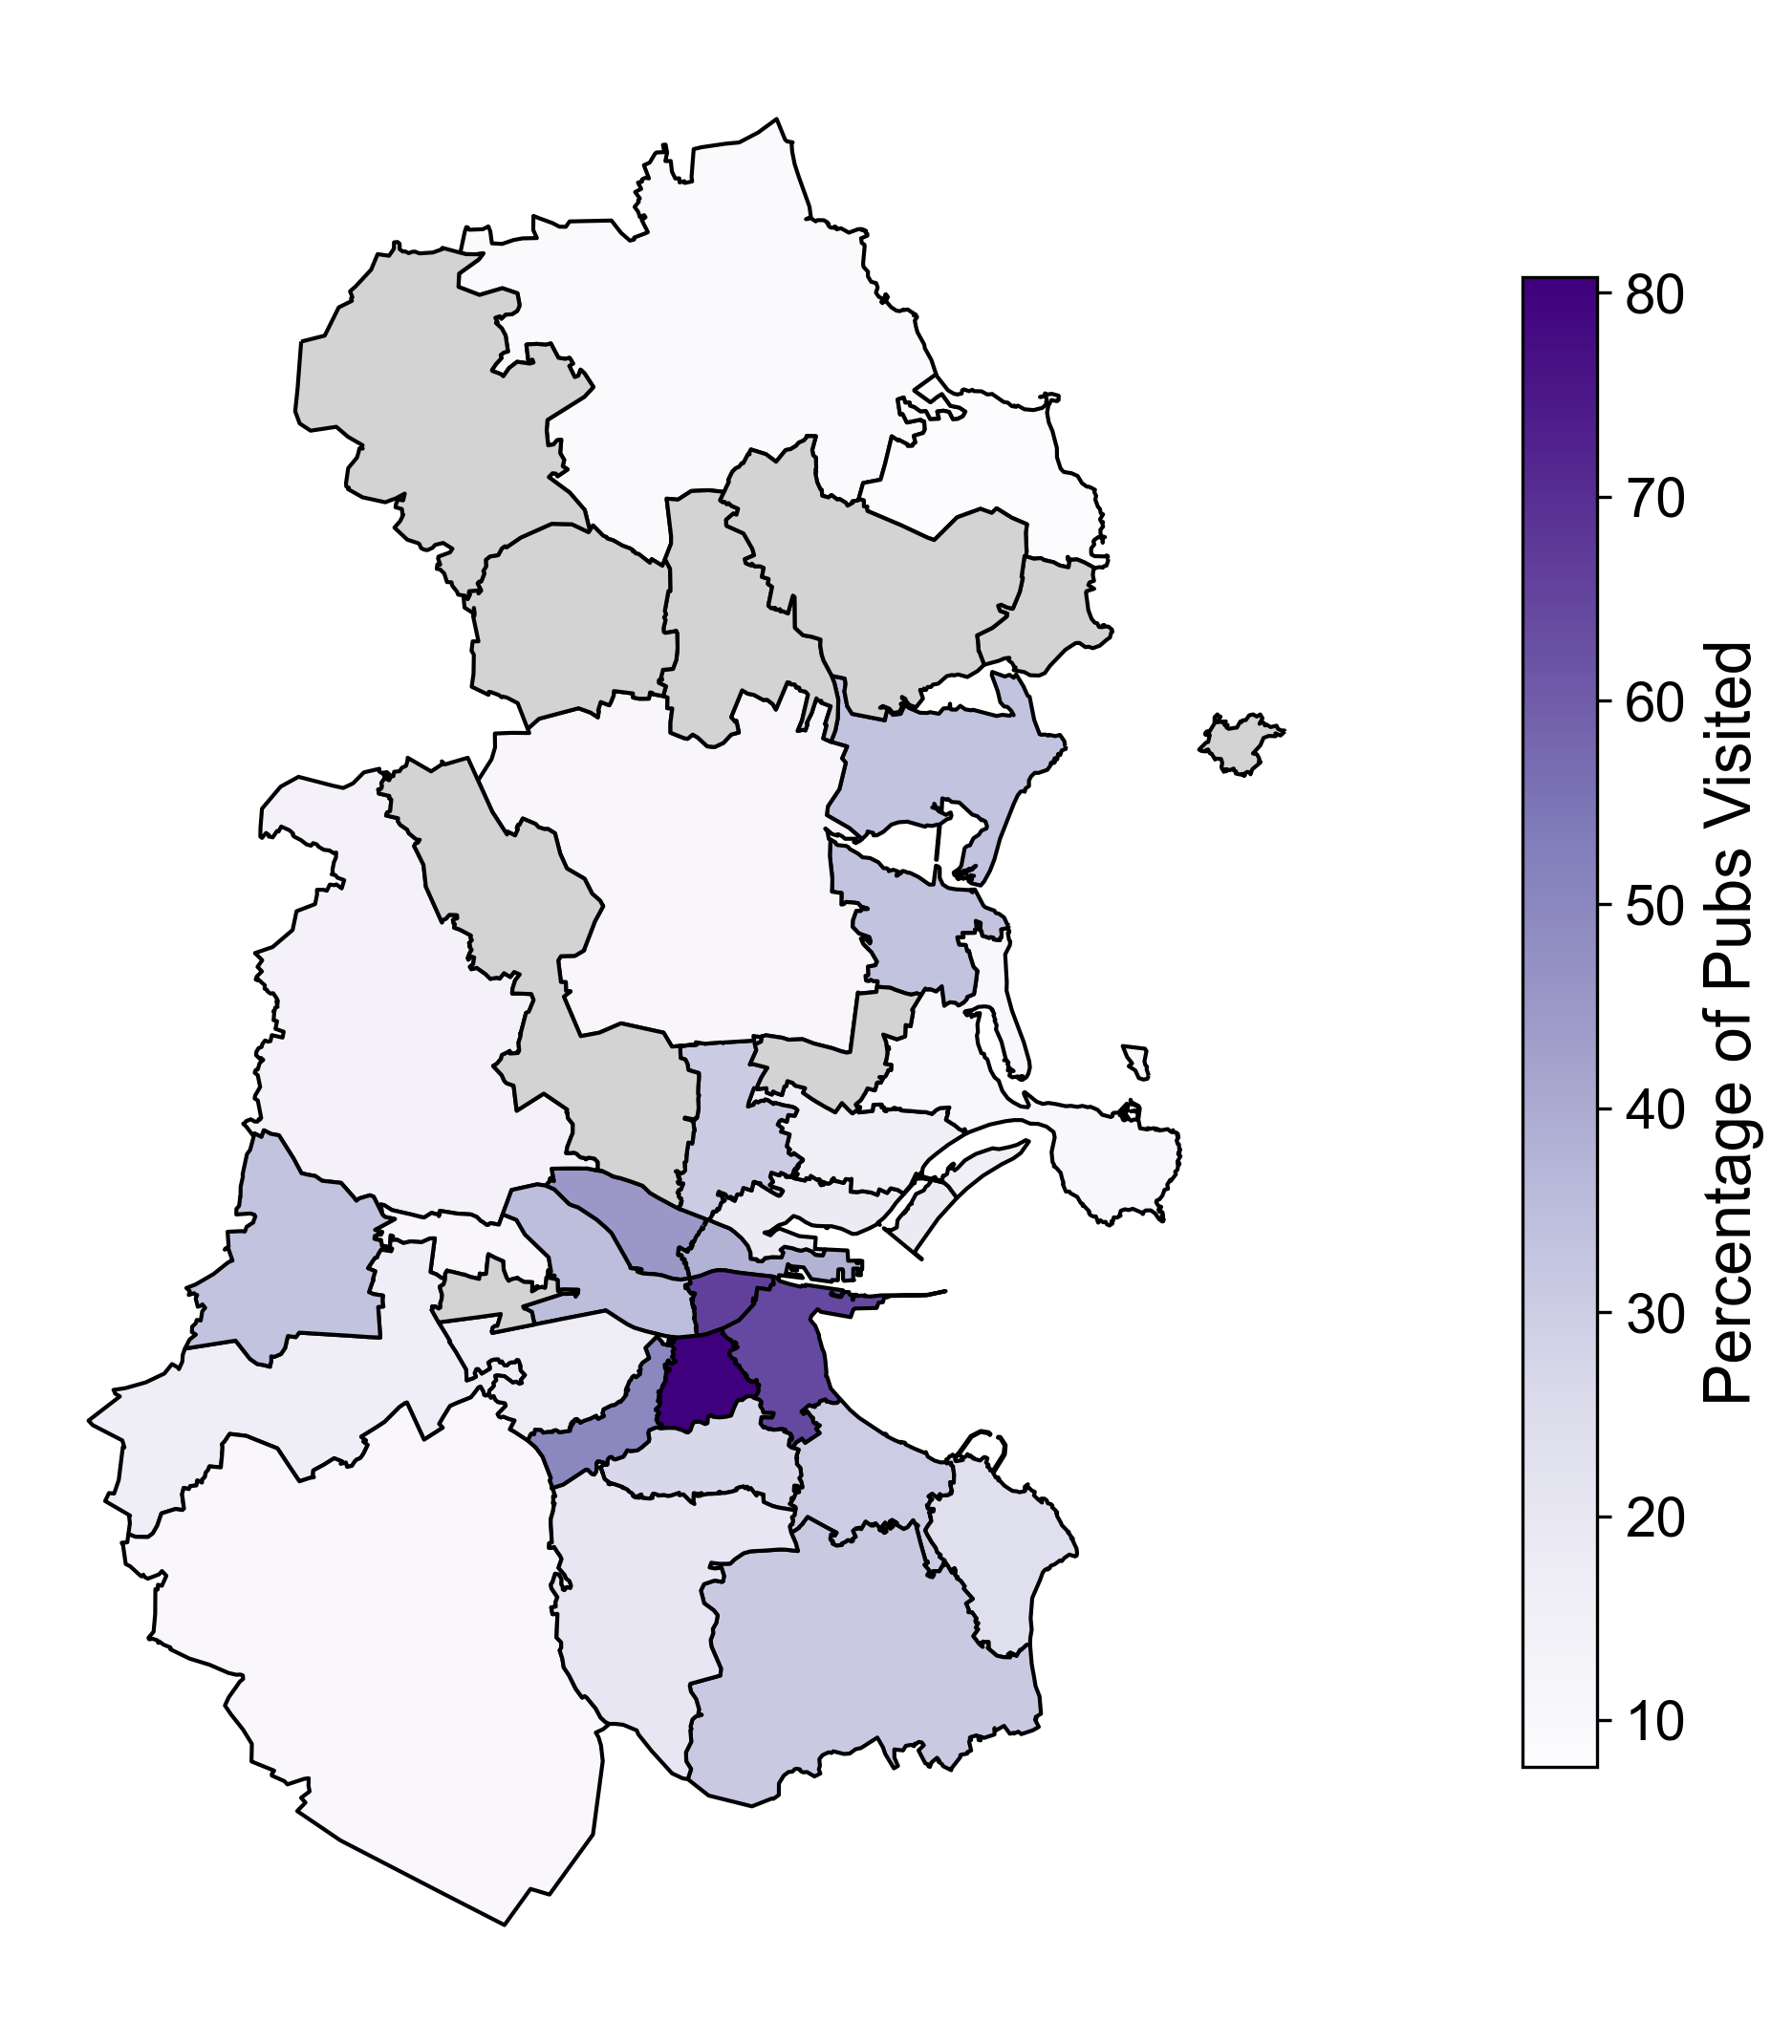
I calculated the percentage of pubs that have had pints submitted for each of the postal regions and this information is displayed in the above map. Dublin 6 has the highest percentage of pubs with submitted pint prices.
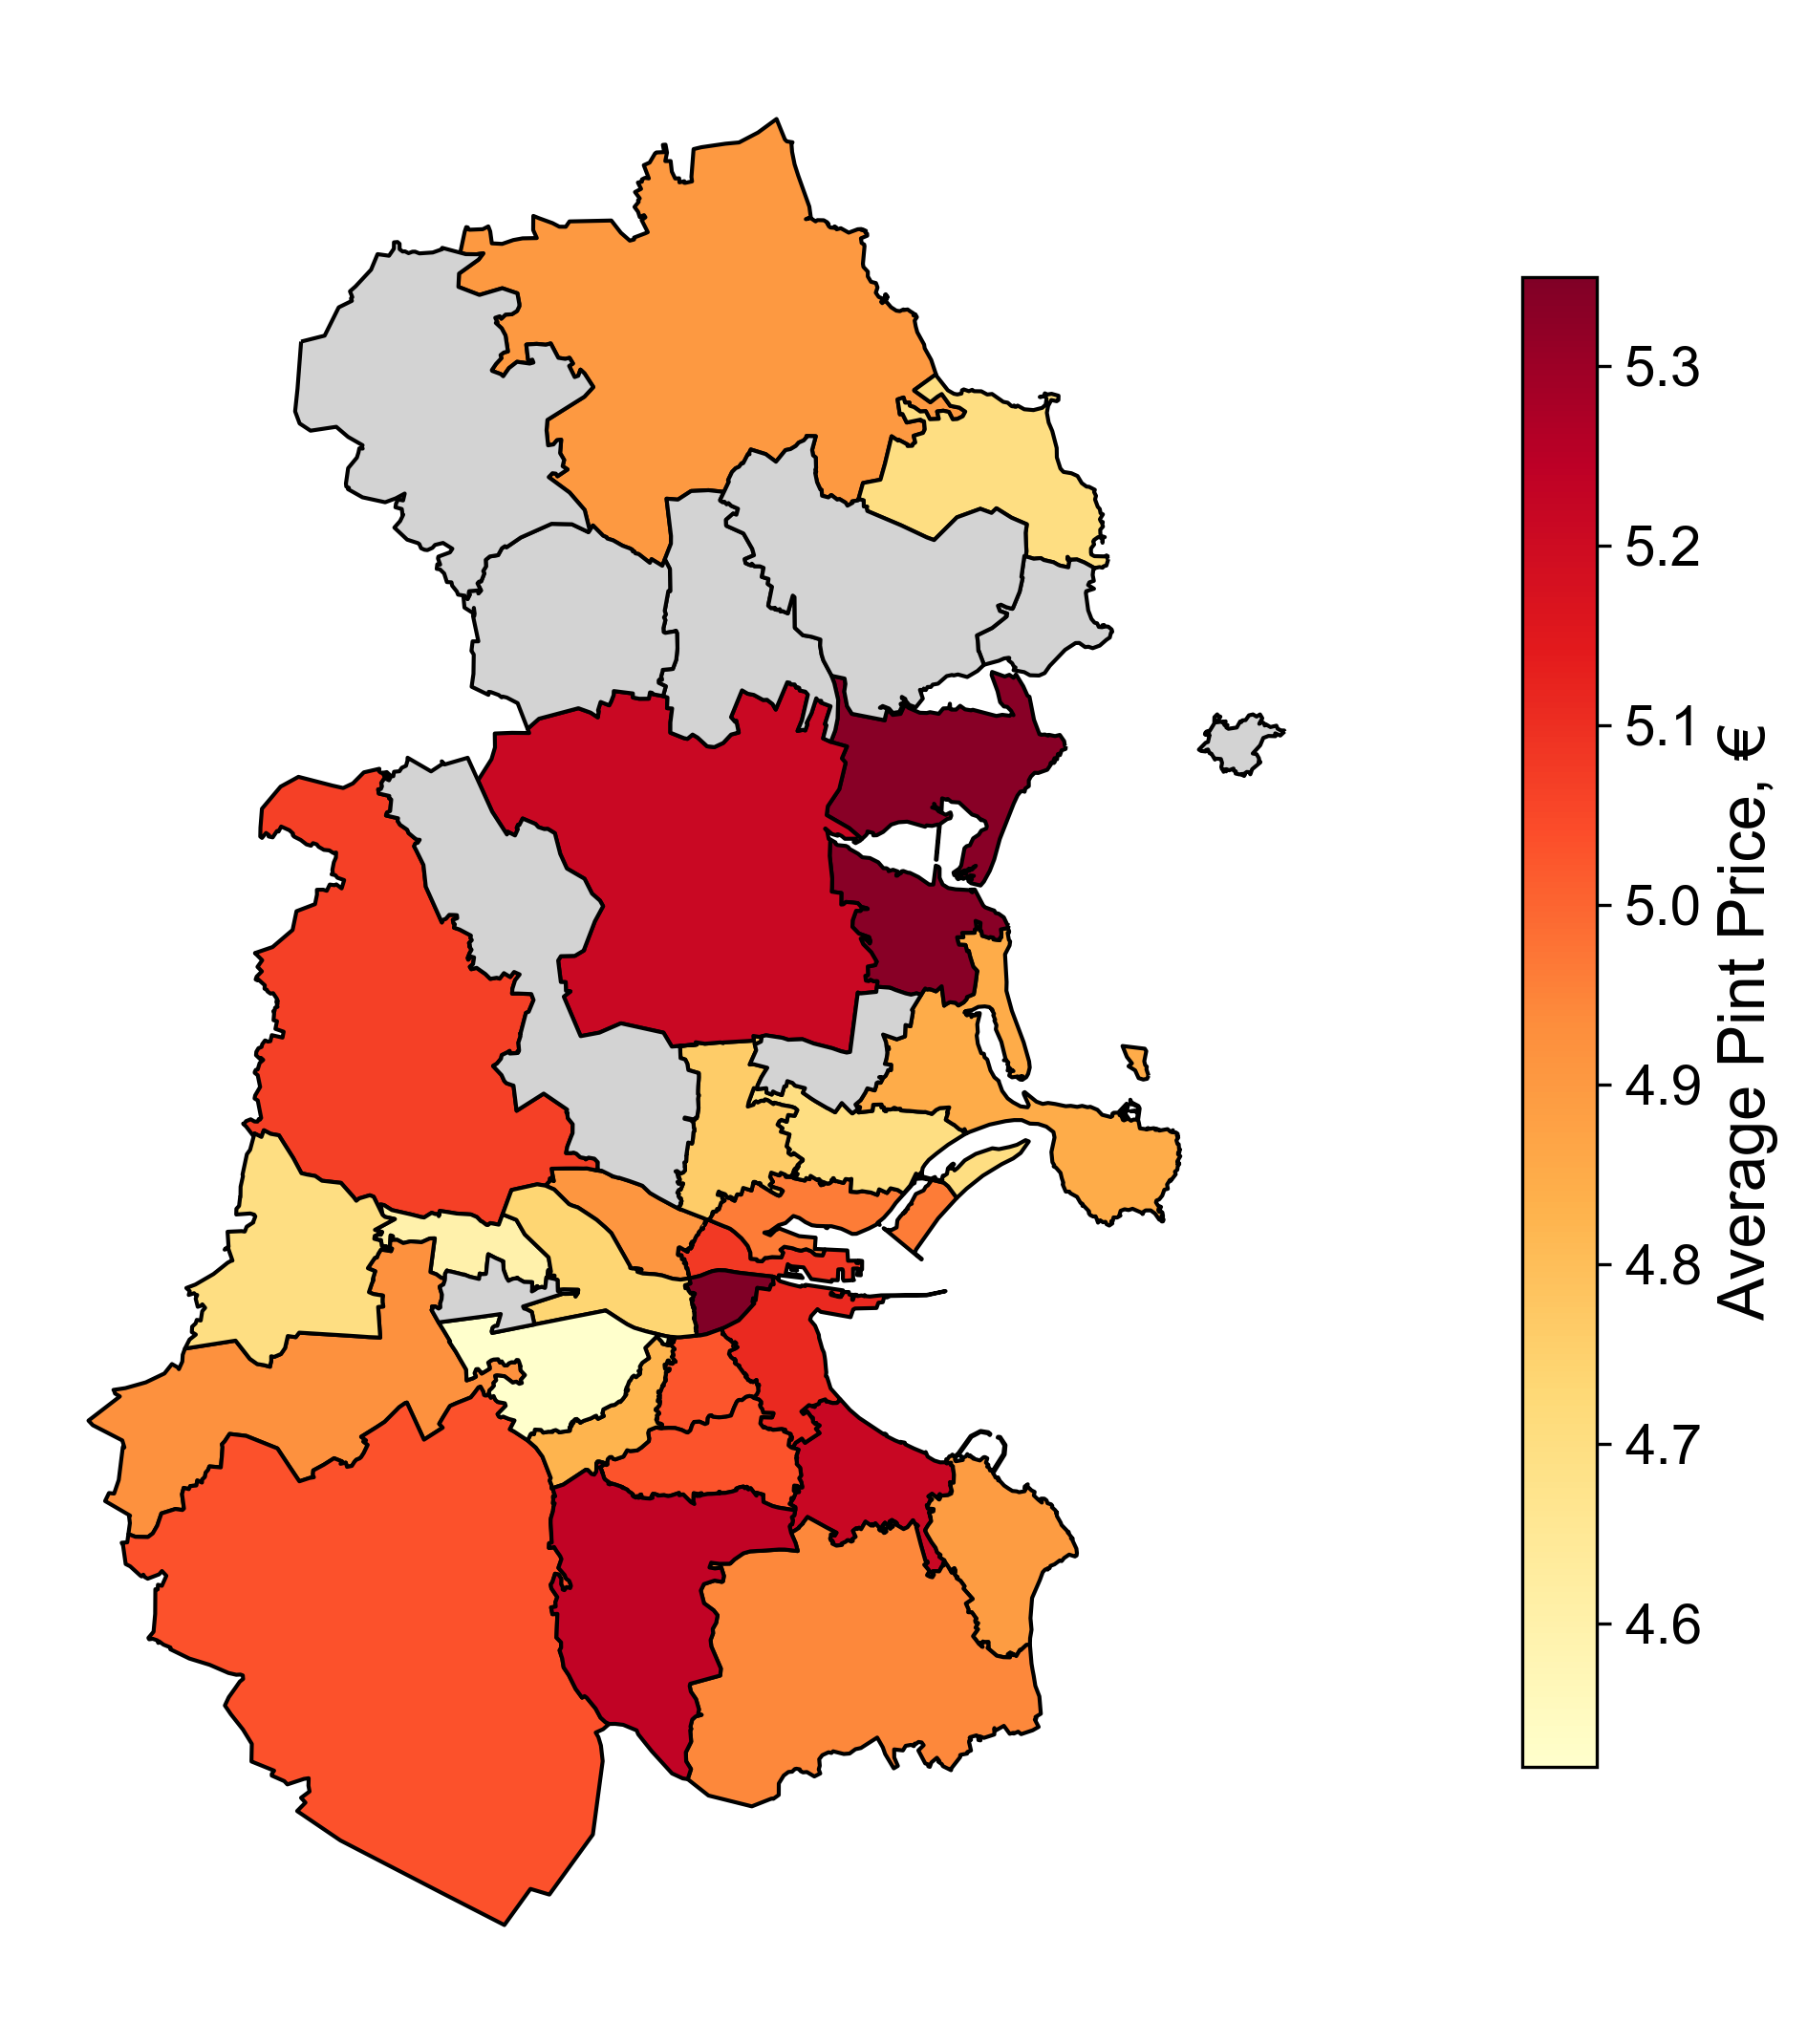
Above is the average pint price from pubs within each of the postal regions. As well as averages we can also look at the distributions of prices within each of the regions
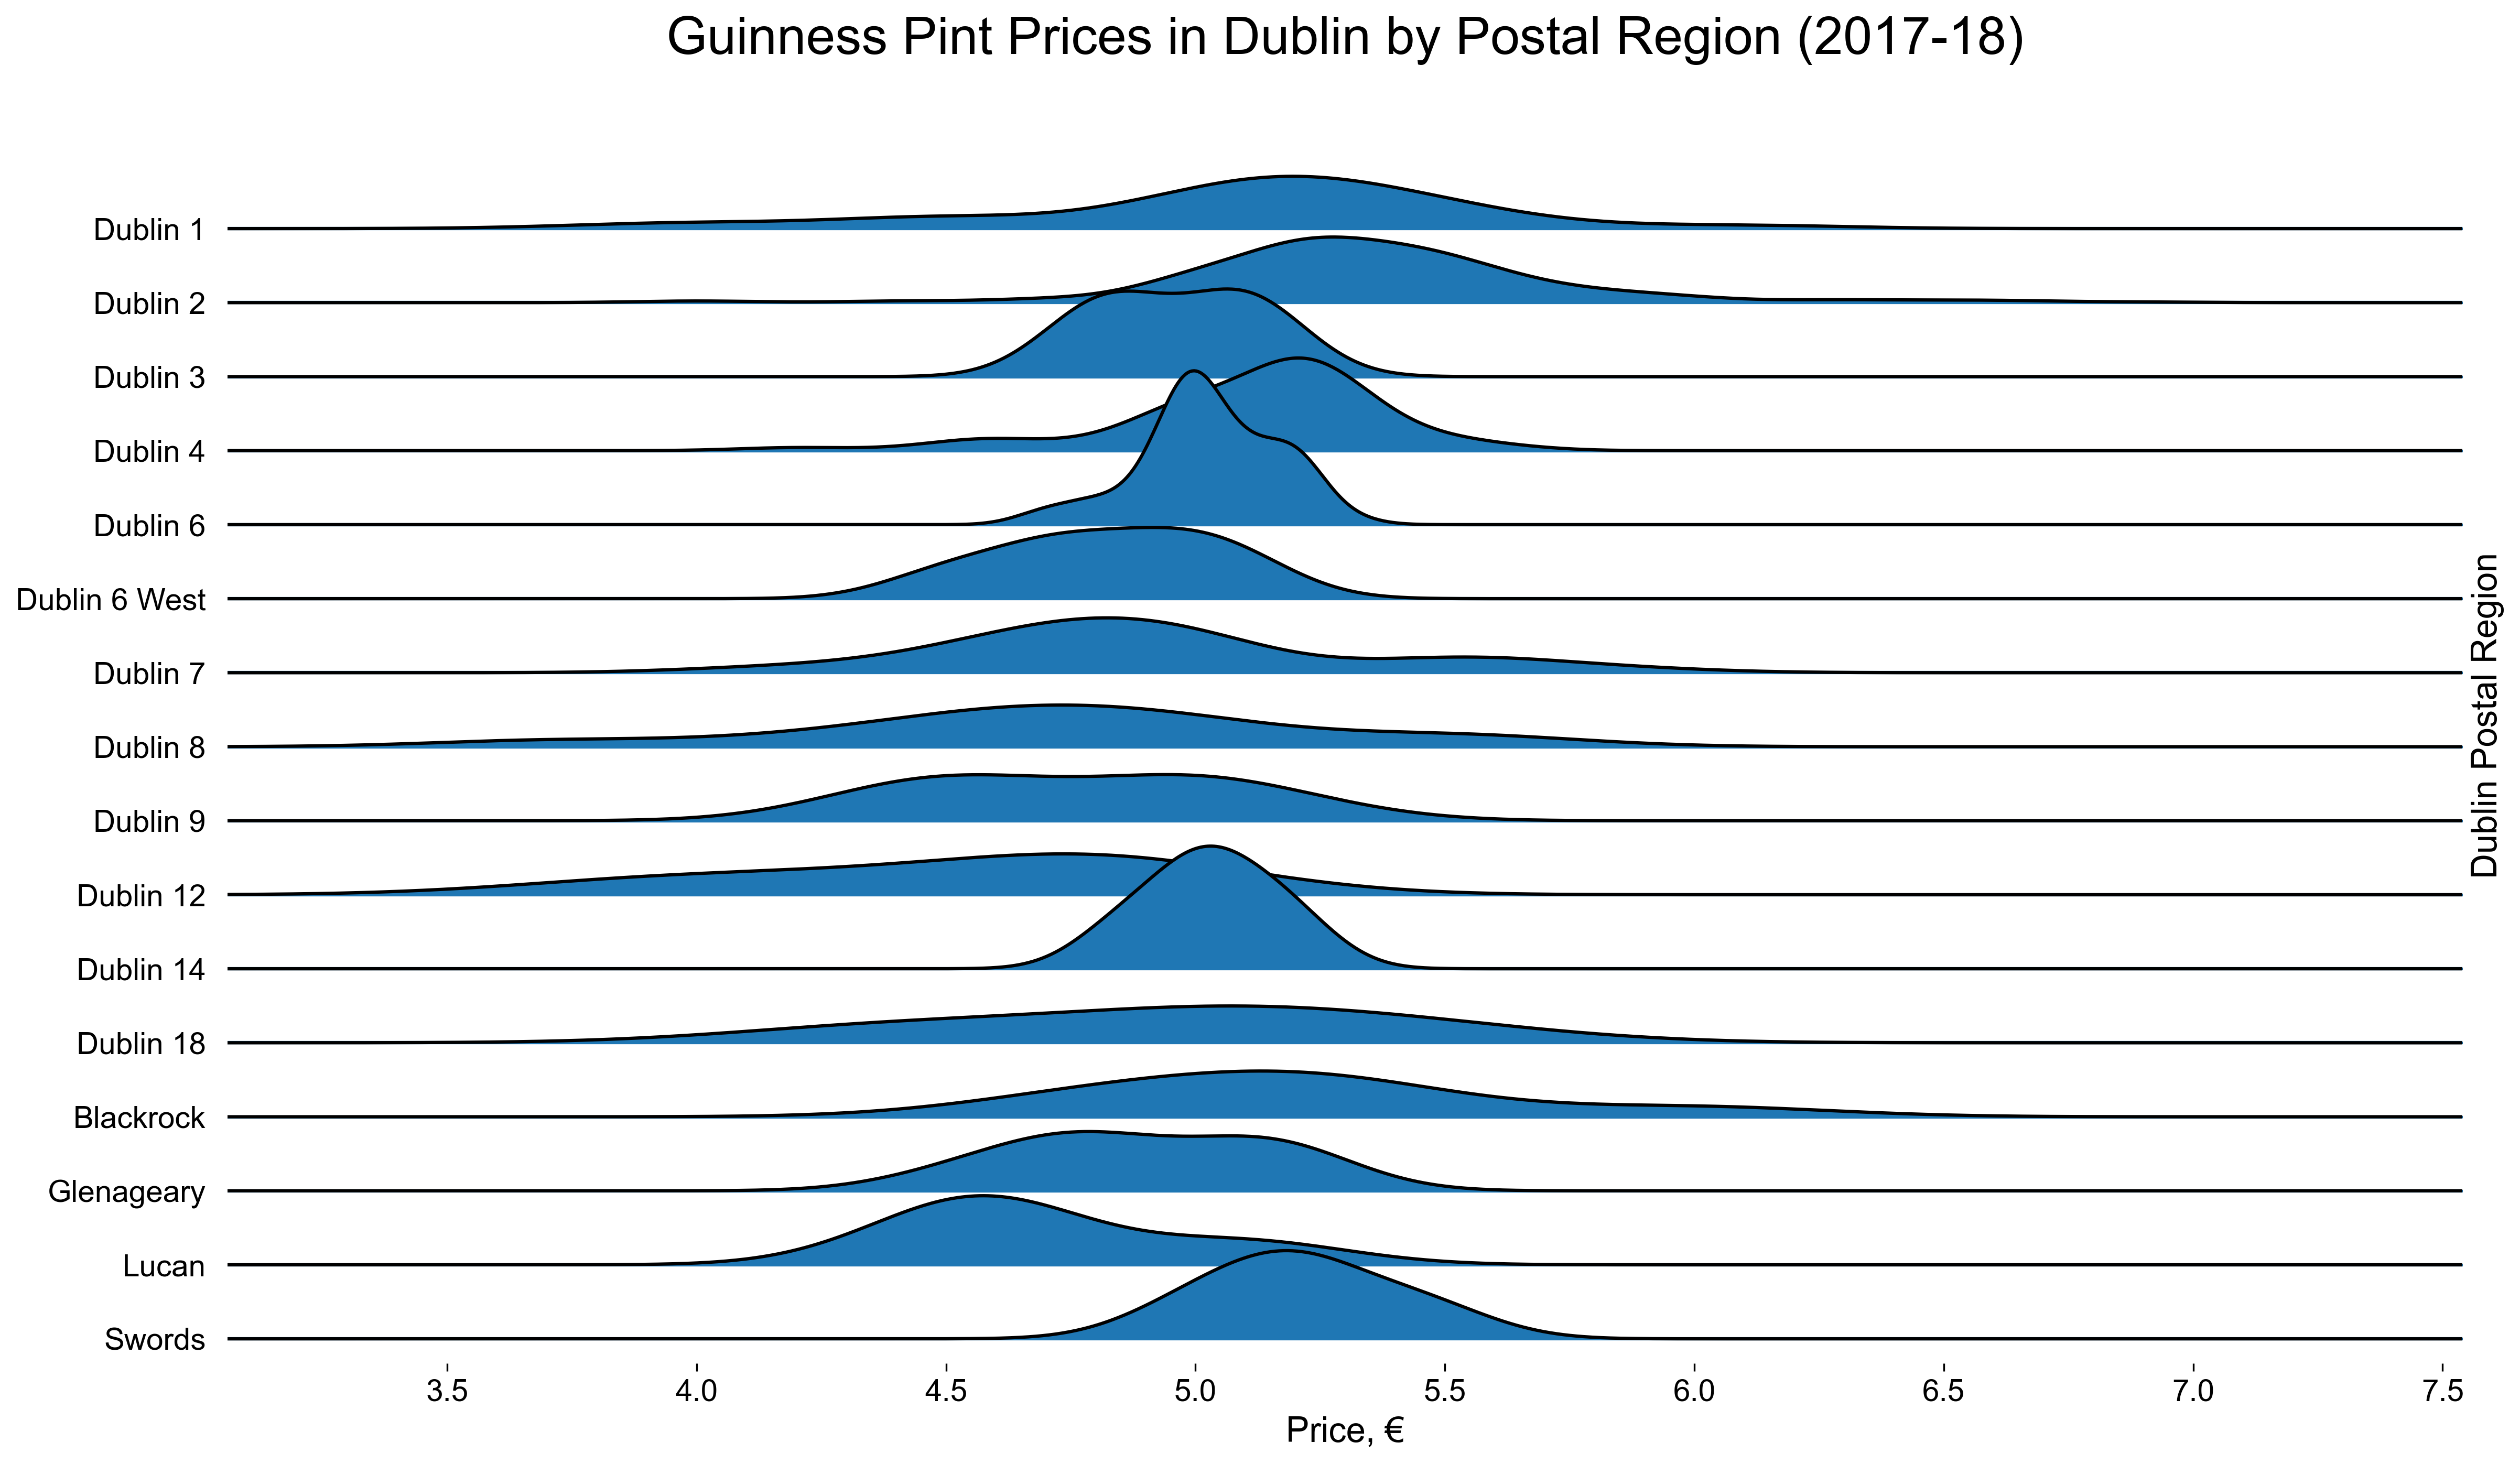
The ridgeline plot above shows the price distributions for each of the postal regions that has at least 4 price submissions.
If you are interested in seeing how this was done the code for this project is available on my GitHub here